Geometric interpretation of divergence
Geometric Interpretation of Divergence in Prop Trading
Introduction
On a busy trading floor, data streams feel like a living map: price moves, volume hums, liquidity flows. The geometric interpretation of divergence gives a compass for navigating that map. Instead of chasing a single indicator, you’re reading how price vectors spread or squeeze, how order flow diverges from price momentum, and how this geometry signals where sharp moves may unfold.
Geometric View: Divergence as a Messenger
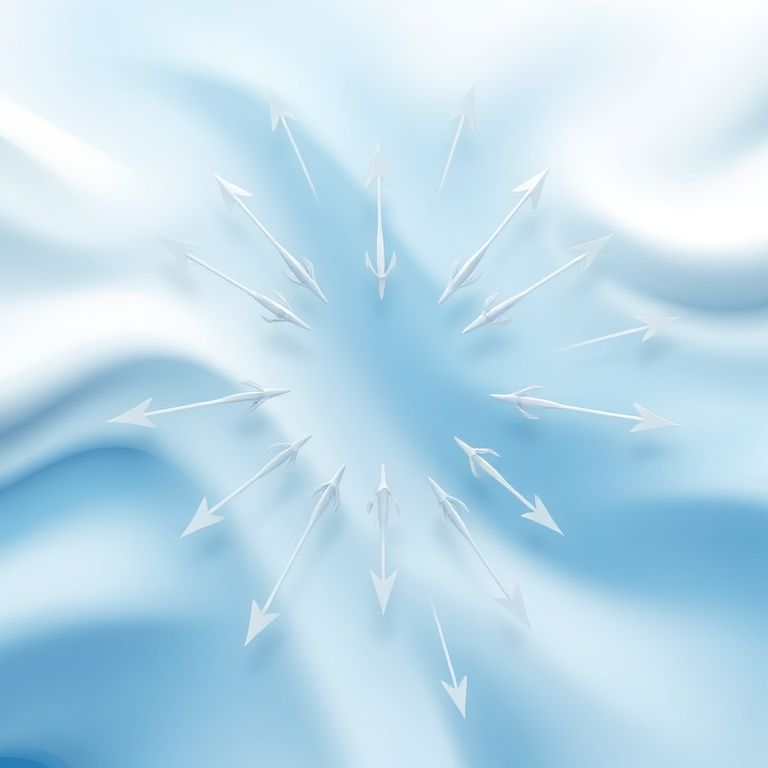
Divergence can be seen as the net flux of a price field. When price keeps climbing but momentum or volume falters, the geometry “bulges” in a way that warns a reversal or a breakout feels different from the last one. If price drops while momentum pushes up, the canvas reveals hidden tension. This viewpoint helps traders connect signals across timeframes and across assets, turning noisy data into a cohesive shape rather than a pile of independent clues.
Key Points and Features
- Cross-timeframe coherence: using a divergence lens across minutes, hours, and daily charts helps distinguish permanent shifts from short-lived wiggles. Think of it like checking multiple contour lines on a map to confirm a plateau or a slope.
- Multi-asset consistency: when divergence appears in several assets that share a macro rhythm—say, a major currency pair and a correlated stock index—the geometric signal strengthens. This reduces single-instrument whipsaws and adds a structural edge.
- Robustness through smoothing: raw price and momentum are noisy. A geometric approach benefits from smoothing steps (kernel filters, multi-sample checks) to keep true divergence from random tremors.
- Visualization as a learning tool: traders who sketch price as a vector field or visualize momentum as a flowing surface report patterns more intuitively, accelerating decision times without sacrificing discipline.
Asset Class Playbooks
- Forex and indices: divergence often foreshadows carry trades, regime shifts, or liquidity squeezes around session transitions. A visible disconnect between price and volume hints at a pending trap or breakout.
- Stocks and commodities: cross-asset divergence helps spot sector rotations. When a stock’s price climbs but liquidity dries up, a geometric lens warns about fading strength.
- Crypto and options: rapid liquidity shifts make divergence signals more actionable, especially when combined with implied volatility surfaces in options. In crypto, where regimes flip fast, geometry acts as a stabilizing guide.
- DeFi and centralization: decentralized liquidity pools add new geometry—flash loans, pool rotations, and cross-chain moves. Reading divergence in this space requires caution for on-chain latency and oracle risk.
DeFi Challenges and Realities
Decentralized finance accelerates experimentation, but it brings forks, bridge risk, and front-running into the geometric picture. Liquidity fragmentation and gas spikes can distort the vector field, so any divergence rule here should include on-chain risk controls and backtests across different network conditions.
Smart Contracts and AI: The New Combo
Smart contracts enable programmable divergence strategies—rules that execute when a geometry cue aligns across assets or timeframes. AI augments this by learning what divergence looks like in evolving market regimes, filtering signals that would have been false positives in the past and adapting to regime shifts.
Prop Trading Outlook
Prop desks can leverage geometry-driven divergence to build market-neutral baskets, diversify across FX, equities, crypto, and commodities, and deploy cross-asset hedges with disciplined risk caps. As AI and smart contracts mature, these strategies become more scalable and auditable, with provenance and backtesting baked in.
Slogan and Takeaways
- Geometric interpretation of divergence: read the pattern, ride the flow.
- Signals that align across time and assets tend to persist longer.
- In DeFi, prepare for edge cases: latency, oracles, and gas cost are part of the geometry.
Strategies to try
- Combine price-mate divergence with cross-asset confirmation before pulling the trigger.
- Use smoothing to reduce noise, then test across multiple timeframes for consistency.
- Keep risk anchors: predefined stop levels, position sizing tied to the strength of the geometric signal, and continuous performance review.
This geometry-informed view helps the modern prop trader stay curious, disciplined, and ready for a future where smart contracts and AI amplify a trader’s sense of the market’s true shape.
Support Pollinations.AI:
YOU MAY ALSO LIKE